Case study · Measurabl

Disclosure

Confidently collect and transform data for compliance and reporting

The problem

The rules are strict and expensive to get wrong, and the people responsible for them were working in spreadsheets.

Asset managers and ESG analysts have to collect their data and transform it to fit many different sustainable-finance reporting requirements, each with its own prescriptive rules.

They also have to be transparent about the methodology behind every transformation. That is the only way to submit with confidence to mandatory frameworks that are audited and assured.

78%

of investors run a structured, methodical evaluation of non-financial disclosures (EY, 2021)

Goals

  1. 01

    Assess and act on compliance risk

    Meet customers wherever they are in the disclosure process, with efficient, automated, self-serve tooling.

  2. 02

    Increase compliance

    Raise adherence to mandatory frameworks, building standards, and regional ordinances.

  3. 03

    Be auditable and transparent

    Make every disclosure ready for third-party audit and assurance requests.

Approach

Double diamond: research to design the right things (discover, then define), then design to design things right (develop, then deliver), moving from problem to problem definition to solution. Research“Design the right things”Design“Design things right”DiscoverIdentify pain pointsDefinePrioritize problemstatementsDevelopIdeation andvalidationDeliverImprovementsand iterationProblemProblem definitionSolution
  1. DiscoverIdentify pain points
  2. DefinePrioritize problem statements
  3. DevelopIdeation and validation
  4. DeliverImprovements and iteration

What we heard

“You shouldn't need to take it offline. You should be able to do it all on the platform, which should be at the heart of everything that's designed. It would be ideal if auditors could even interrogate directly through the platform.”

ESG Specialist, Asset Management Division

One report, four kinds of people

  • Asset ManagersFund managers, sustainability reporting managers, analysts, ESG controllers, sustainability consultants
  • Property ManagersProperty and site managers
  • Measurabl InternalSupport, customer success, product, engineering, advisory
  • Third-Party AuditorsAuditors and assurers
  1. 01(Asset Managers)Tasked with producing a report for disclosure under SFDR
  2. 02(Asset Managers, Measurabl Internal, Third-Party Auditors)Understand the data the disclosure requires
  3. 03(Asset Managers, Property Managers)Log in to Measurabl: Core, Insights, and Disclosure
  4. 04(Asset Managers, Measurabl Internal)Identify data gaps and risks
  5. 05(Asset Managers, Property Managers)Collect and enter missing site-level data
  6. 06(Asset Managers)Select a group and open the SFDR impact report
  7. 07(Asset Managers)Review pre-calculated metrics, add inputs
  8. 08(Asset Managers)Review question guidance and metric methodology
  9. 09(Asset Managers)Enter explanations, actions taken, custom indicators
  10. 10(Asset Managers)Preview the report
  11. 11(Asset Managers)Export as PDF
  12. 12(Asset Managers, Third-Party Auditors)Include settings and methodologies in the export
  13. 13(Asset Managers, Third-Party Auditors)Publicly list the disclosure on the website
  14. 14(Asset Managers, Third-Party Auditors, Measurabl Internal)Submit to the regional market authority

The brief

Our users need an intuitive, collaborative way to navigate and demonstrate alignment with each reporting requirement, so they stay ahead of their obligations and keep their portfolios competitive.

The flow we designed to

  1. 01Fund identifies which assets must disclose
  2. Engage Measurabl support02Create a subgroup of the assets in the report
  3. 03Identify data gaps
  4. Bulk upload certs, ratings, meters, projects04Collect supplementary data
  5. 05Review regulation onboarding: what is being asked, and how Measurabl helps
  6. 06Opt to provide additional inputs
  7. 07Review pre-calculated metrics and methodology
  8. 08Enter inputs, explanations, actions taken, custom indicators
  9. 09Preview the report
  10. 10Export in the chosen format
  11. Third-party auditor reviews the data11Share with internal reviewers
  12. 12Publicly list the disclosure
  13. 13Submit to the regional market authority

Four design decisions

  1. 01

    Organize around obligations, not data

    The dashboard is a list of reports, not a list of buildings. Each report carries its regulation, disclosure window, due date, and status, and the default sort is nearest due date.

    Tradeoff Anyone who thinks building-first has to choose a report before they see data. Exploring data stays in Core and Insights.

  2. 02

    Show readiness before the survey starts

    Every report card summarizes majority asset location, meter data completeness, missing inputs, and survey progress, and each one links to where it gets fixed.

    Tradeoff A denser dashboard, and numbers that can alarm people before they have context for them.

  3. 03

    Put the methodology next to the question

    Each survey section opens with question guidance. Pre-calculated metrics show their methodology, and every answer has room for an explanation and the action taken. Methodologies can travel with the export.

    Tradeoff A longer, wordier survey. We chose to make people read rather than let them submit something they could not defend.

  4. 04

    Treat the audit trail as part of the product

    The exports log records who exported what, in which format, when, and in what role. It links to the change log for every edit to buildings, meters, and spaces.

    Tradeoff Building for a moment that comes months after onboarding. The value is invisible in a sales demo and obvious during an audit.

Reports dashboard

Every obligation in one place, ranked by what is due next.
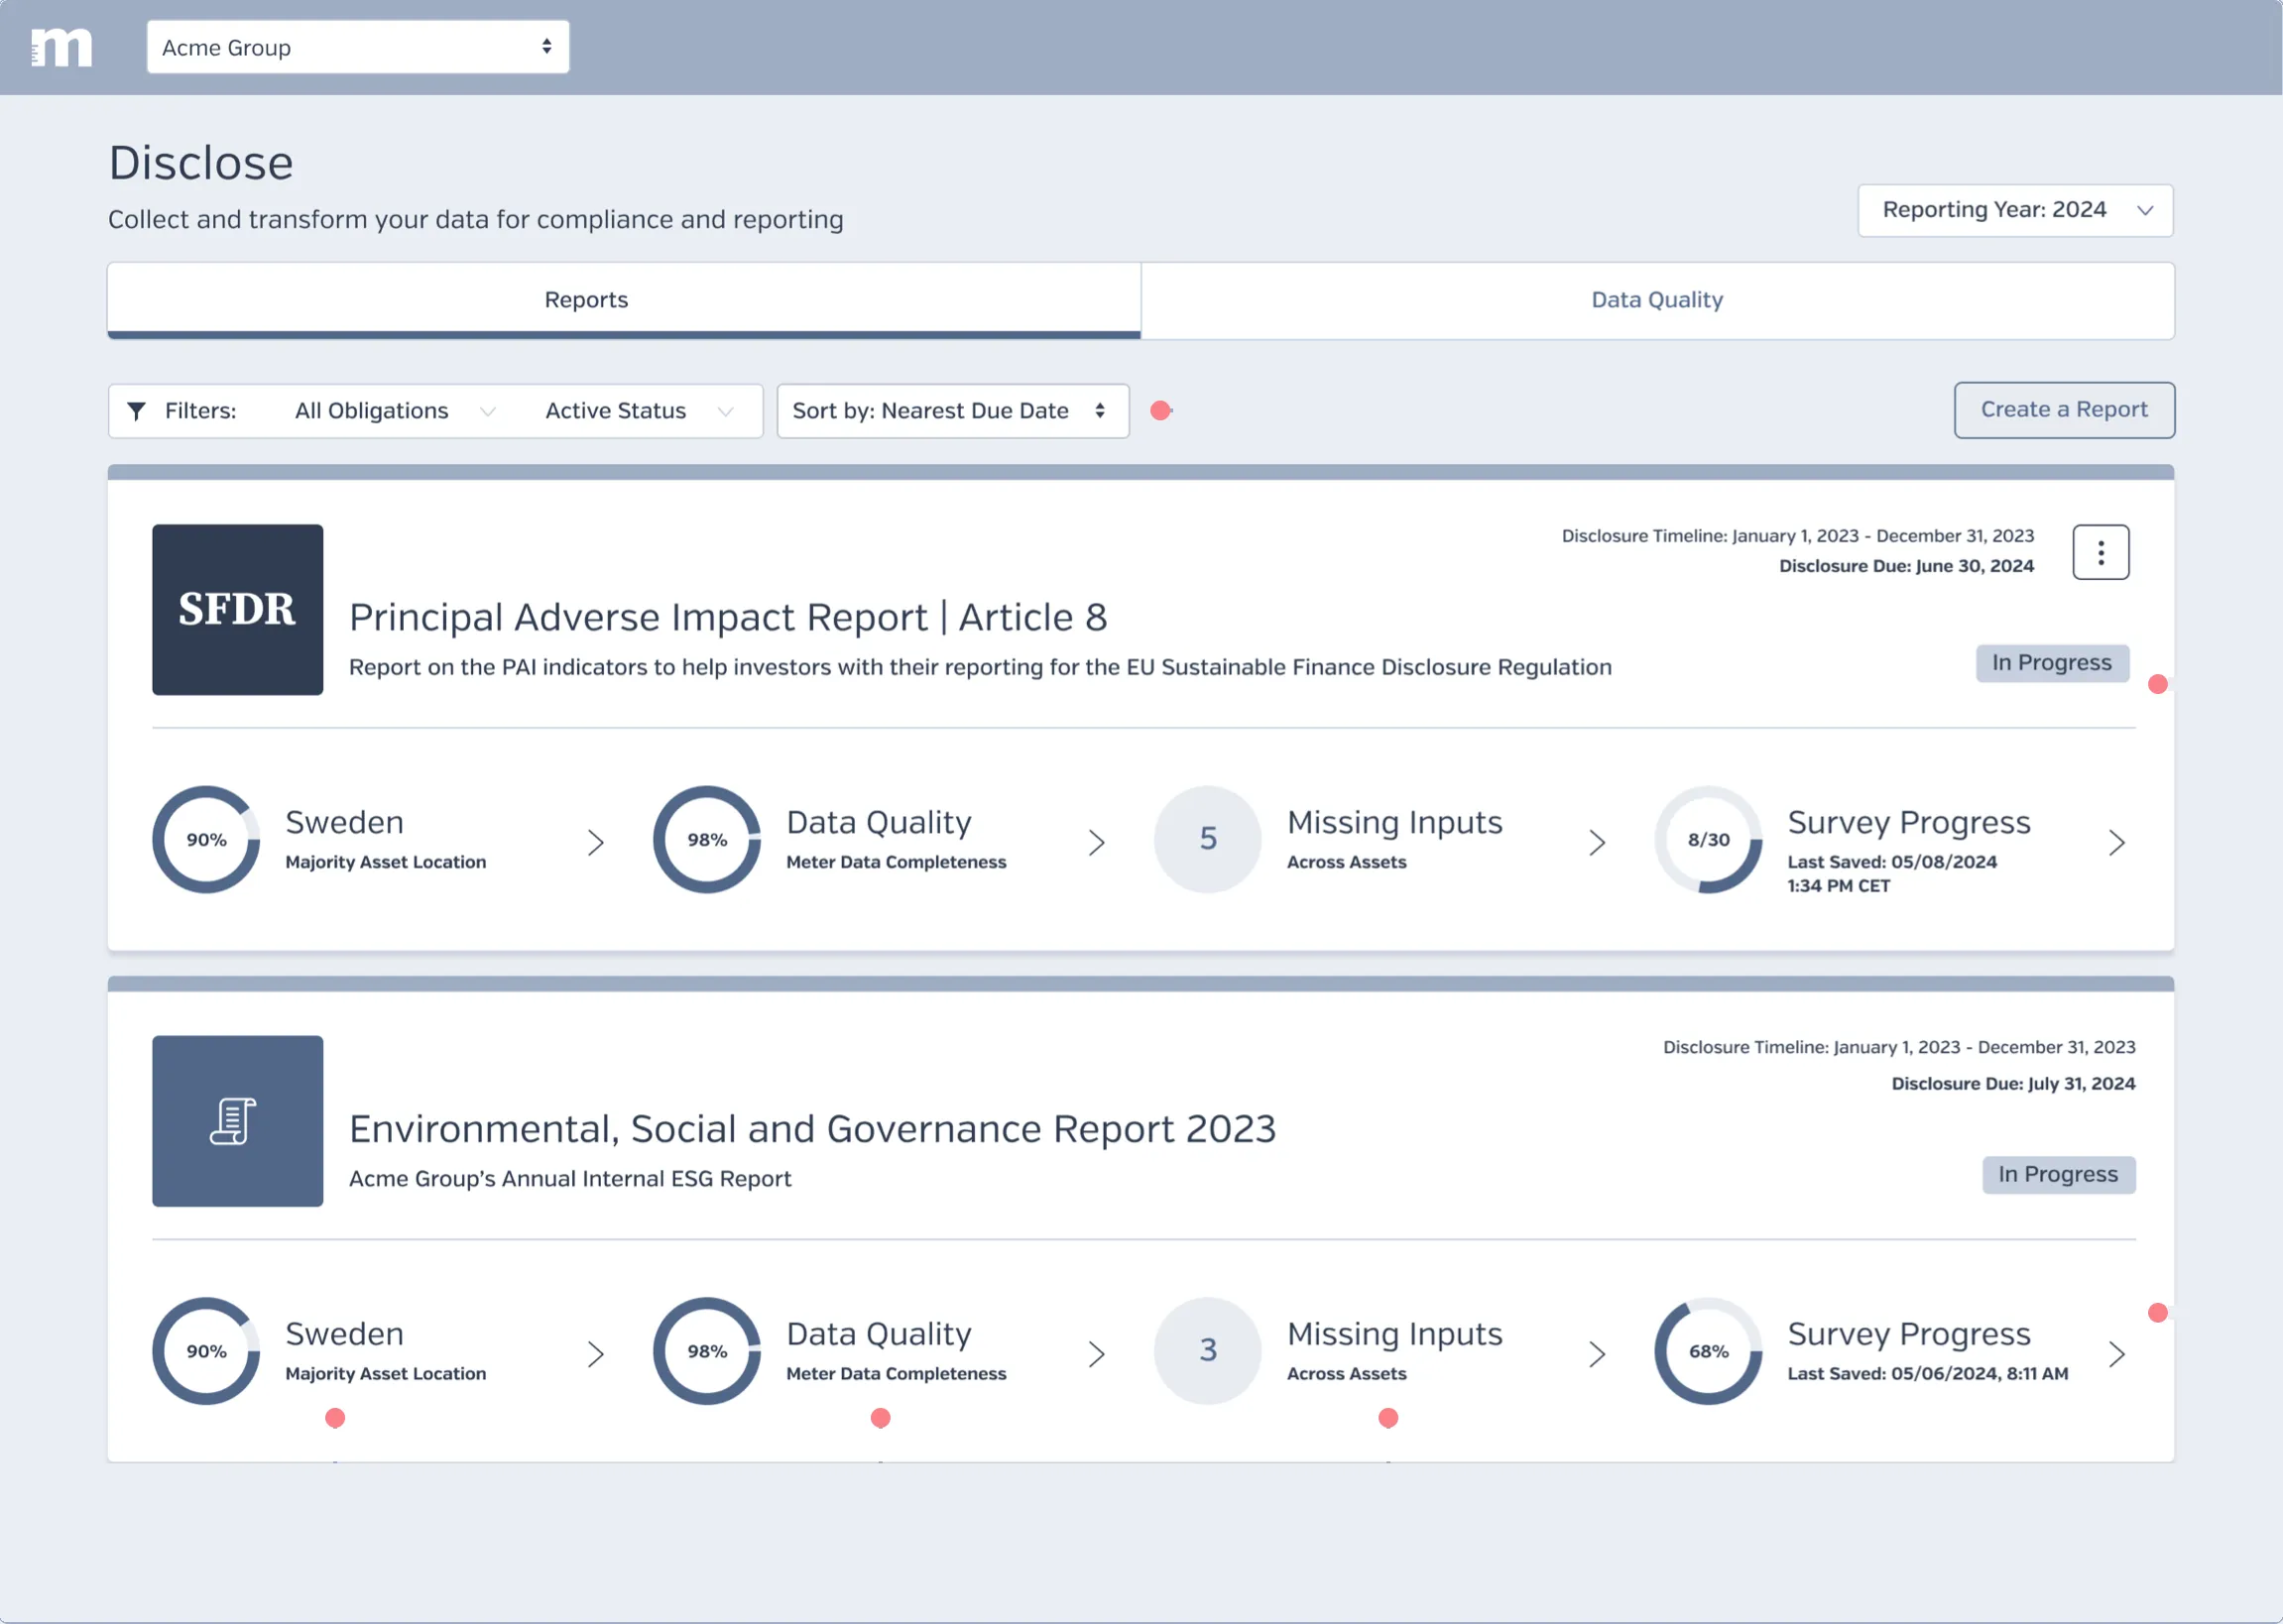
The Disclose dashboard listing an SFDR Principal Adverse Impact report and an annual ESG report. Each card shows the disclosure timeline, due date, status, majority asset location, meter data completeness, missing inputs, and survey progress.
  1. Sort by nearest due date to stay ahead of disclosures and avoid penalties.
  2. See at a glance which reports are not started, in progress, or ready to submit.
  3. Track survey progress, including when it was last saved or auto-saved.
  4. Understand the data behind each report: fund characteristics, data quality, and completeness.

Report survey

Guided inputs, with the methodology beside every question.
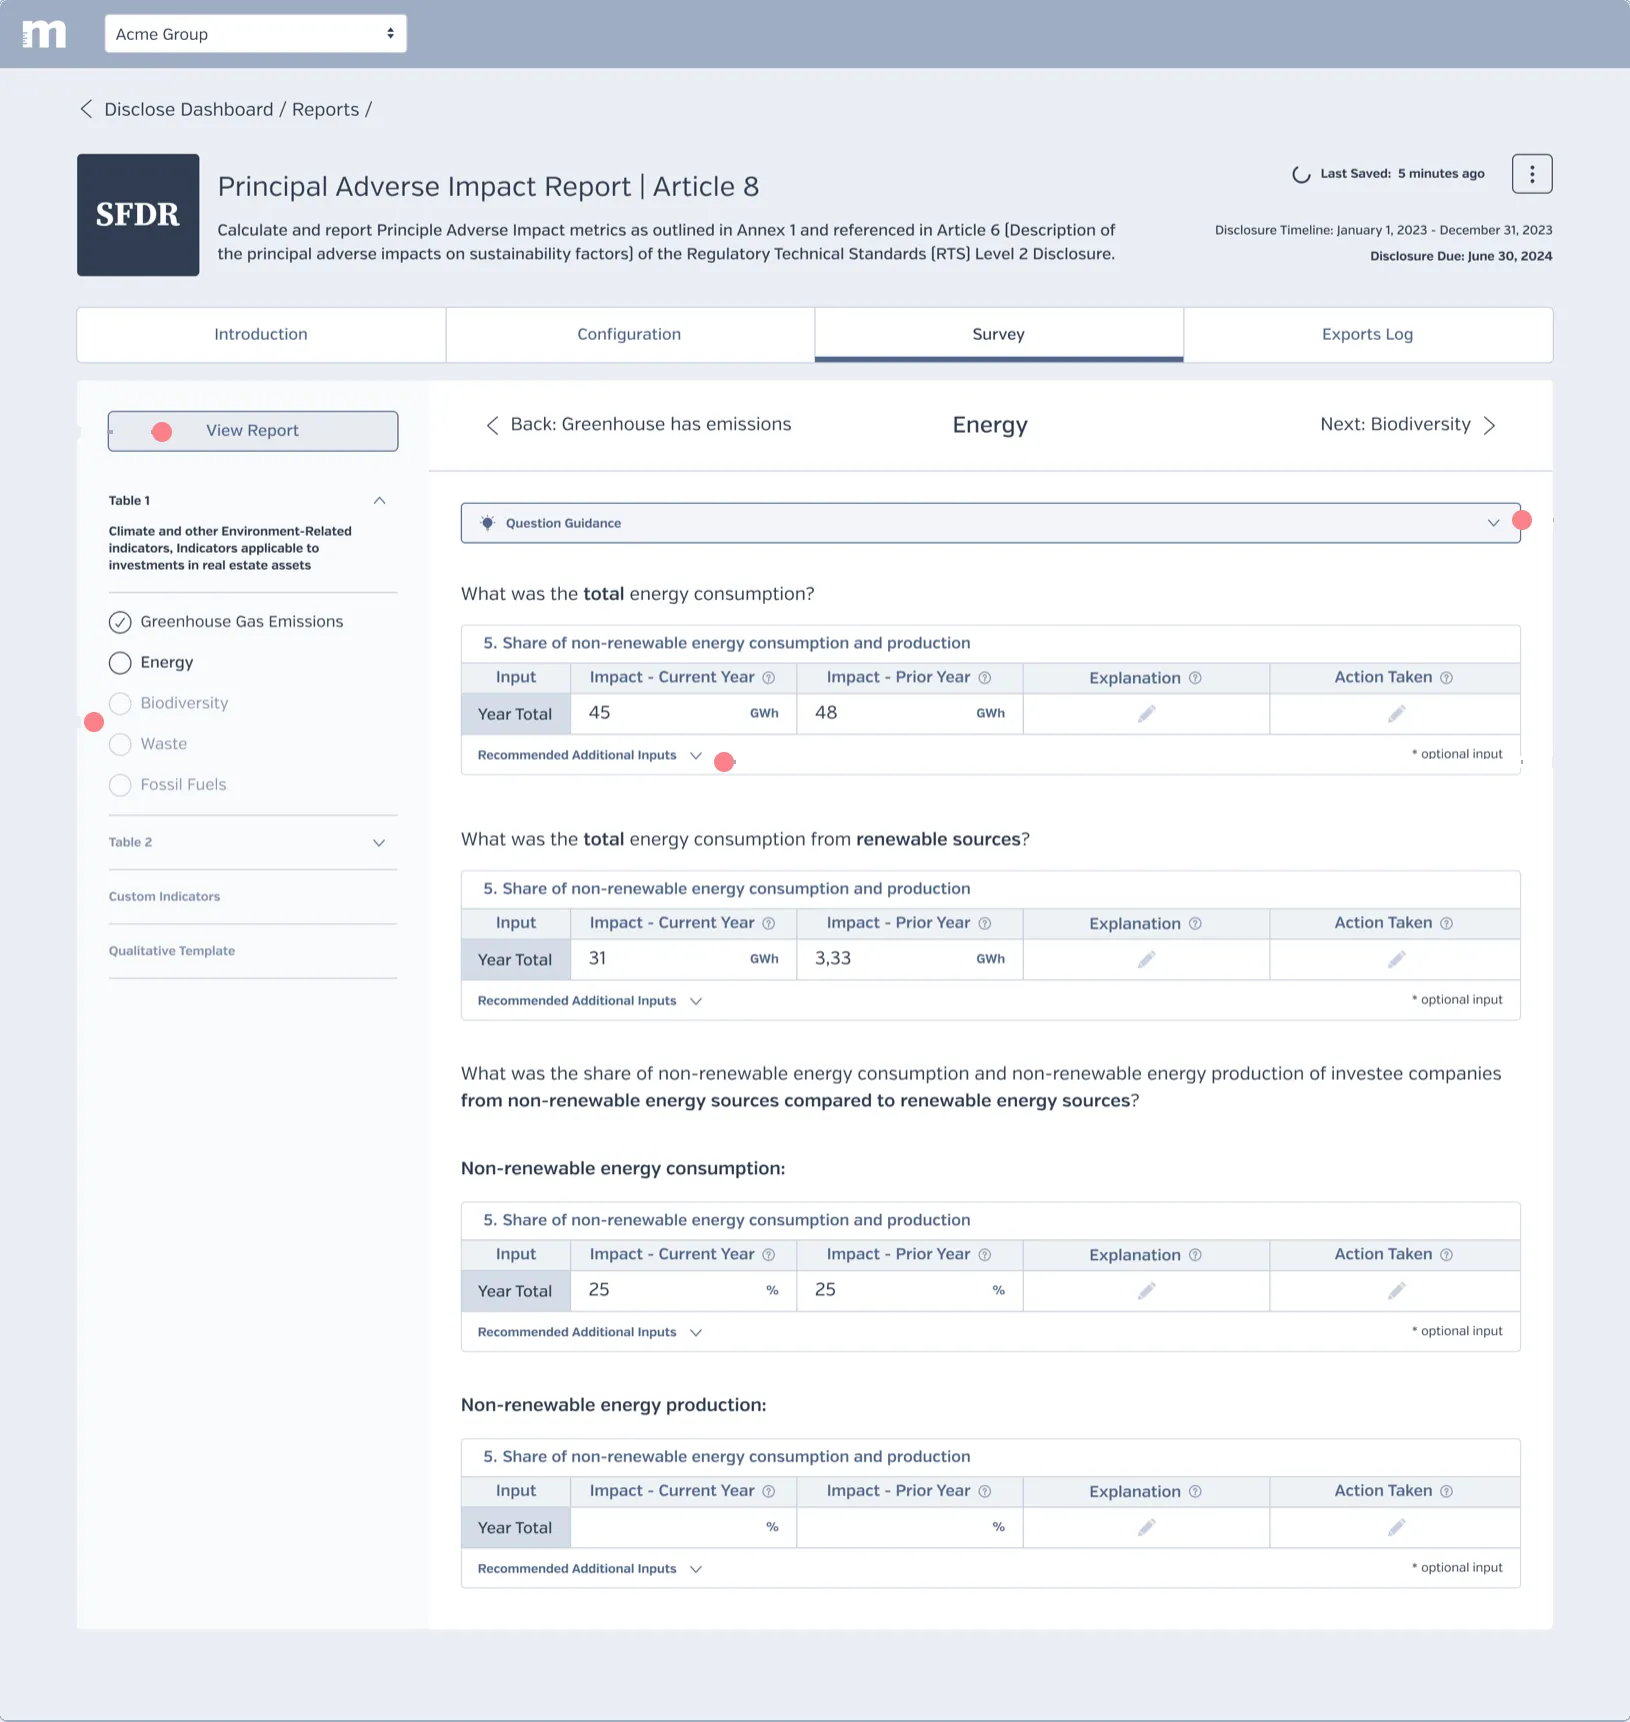
The survey tab of the SFDR report, open to the Energy section. A sidebar lists the survey sections with completion states, and each question shows current- and prior-year impact with fields for an explanation and the action taken.
  1. Preview the report before exporting and submitting.
  2. Move between survey sections and see what's complete and what's ahead.
  3. Question guidance for each section explains which inputs count, and how.
  4. Add input rows for additional metrics, such as quarterly averages or totals.

Exports log

A record an auditor can follow without asking.
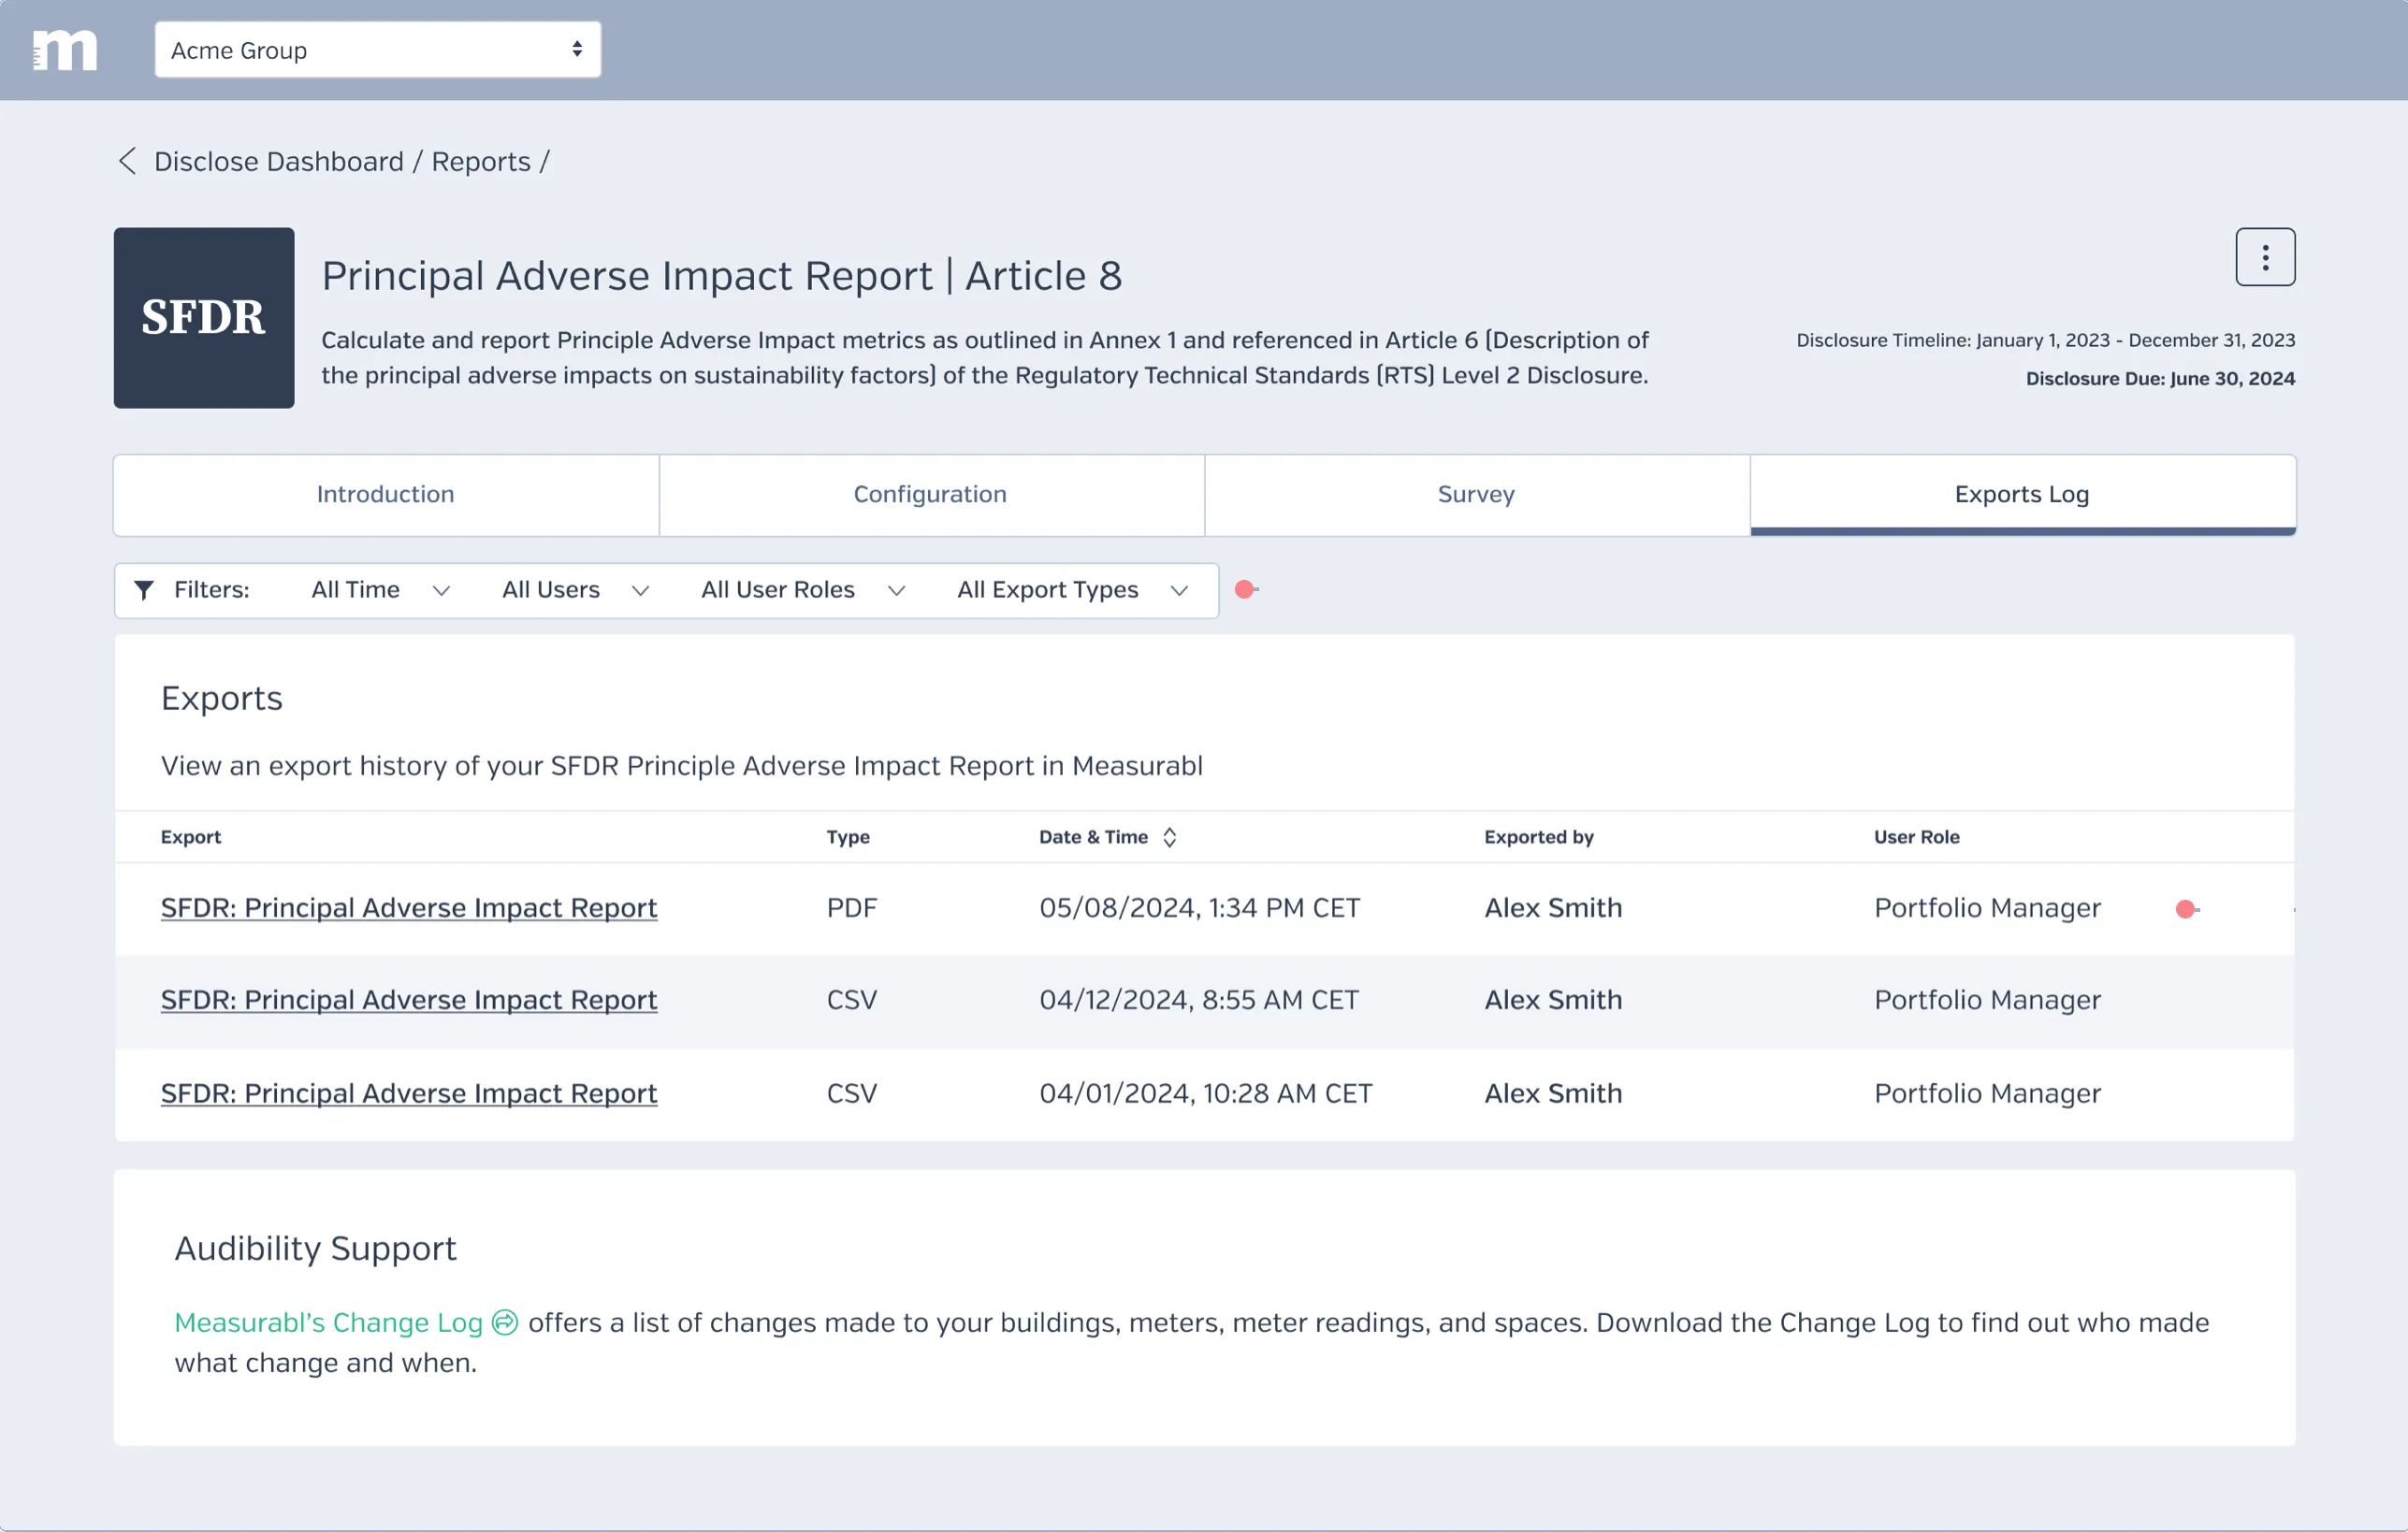
The exports log for the SFDR report: a filterable table of PDF and CSV exports with the date and time, who exported each one, and their role, above a panel linking to Measurabl's change log.
  1. Filter the log by what matters most: time, user, role, or export type.
  2. Every export records who ran it, the file type, and the date and time.
  3. The change log covers every edit to buildings, meters, readings, and spaces.

Where it landed

In customers’ hands

Launched to an early access program with SFDR Principal Adverse Impact reporting and custom internal ESG reports.

Strong usability scores

Early-access participants rated it highly on the System Usability Scale, and continuous discovery sessions kept going after launch.

One suite, one login

Disclosure sits beside Core and Insights, so gaps found in a report are fixed in the same platform the data lives in.

Takeaways

  • Reporting and compliance are collaborative. Several personas, some outside the customer’s company, are needed to create and submit a single report.
  • Data completeness and quality are the foundation. Good reporting software is mostly good data software.
  • Cross-discipline working groups are extremely effective. People from different disciplines, all working on the same problem, made faster and better decisions.
  • Continuous discovery works. Testing throughout early access caught problems while they were still cheap to fix.

Thank you

Questions?

hello@shelby-mason.com

01. DisclosureShelby Mason